You’ve created a brand new social media account and have crafted a killer social media strategy. Great!
But, how effective is your strategy? Is your social media content driving tangible results? Is your audience growing month-on-month?
The power of social media marketing comes from being able to track the impact of your work in real-time and make improvements when needed. And, a monthly social media report can be the perfect way to track the growth of your social media presence and help you refine your social strategy.
Essentially, by keeping tabs on your businesses’ social media metrics, you’ll not only be able to figure out what’s working, but also identify what needs to be improved. Clear social media reporting is what will enable you to create a winning social media strategy.
No idea where to start with social media analytics and monthly reporting? Let’s walk you through the process of creating your own social media report using real-world examples.
What is a social media report?
Before we dive into the stats and numbers, let’s start with the basics.
A social media report is a document that shows and records information about your social media activity. It covers everything from the growth of your audience to the performance of your social media content as well as the results from any paid social media campaigns you’ve been running.
The way a social media report is displayed really depends on who will be reading it. If you’re a social media manager presenting results to a client, you might create a visual presentation. However if your report is an internal document for your content team, a few tables of results might be a better use of your time.
In an ideal world, a social media report would have three elements: results, learnings and recommendations. You may need to create many reports to cater to various audiences or purposes and you can choose your reporting scheduling (whether it’s weekly, monthly, quarterly or yearly).
Why do social media reports and analytics matter?
How can you tell if your social media content is resonating with your audience? By digging into your social media analytics and creating regular monthly social media reports.
Ultimately, social media reports allow you to benchmark your results, track performance and adjust your social media strategy. These metrics give you concrete proof of whether or not your current approach is working and how to pivot your social media content to boost your reach, drive meaningful engagement and increase your chance of conversion.
So, which statistics and data should you focus on when creating your monthly social media reports? The answer will most likely be determined by your unique social media goals and objectives.
Examples of analytics to include in a social media report
Depending on your social media goals, you’ll have a stack of different metrics you’ll want to track in your social media reports.
Here are some examples of popular metrics to track and what they mean for your social media presence:
• Followers (and follower growth) indicate the number of new users that are choosing to connect with your brand on social media. While followers can be a vanity metric, it’s still worth tracking how many new users discover and follow your brand to assess how your audience is growing.
• Clicks indicate that the user is interested in the stuff you’re sharing. Clicks direct visitors to a URL and can help to boost traffic to your website (getting your followers one step closer to making a sale, signing up to your mailing list or submitting an enquiry form).
• Reach indicates how many social media users are served your content. The bigger your reach, the more eyeballs your content is getting (and the higher chance you have of converting users into customers at scale).
• Engagements indicate how many users are taking action on your content. It’s important to focus on high-value engagements (such as comments, saves and shares) that indicate high conversion intent.
The importance of comparing your results over time
Along with tracking the right metrics, being able to review your progress over time helps you understand if your brand is gaining traction on social media.
By comparing your latest month’s results to the previous month (or the same time last year) you can contrast and benchmark your analytics across time frames.
Since month durations can vary, it can be helpful to choose a 28-day timeframe for monthly reporting to ensure consistency throughout the entire year.
A slide-by-slide template for your monthly social media report
Your social media report should be visually appealing and easy to read. Rather than simply sharing numbers and tables, it’s important to bring your social media reports to life with insights and strategic storytelling.
To get you started, below is a simple outline for your analytical report. Feel free to mix and combine these sections to develop a unique social media reporting tool that meets the needs of your business or client.
Always start with an introduction
Your social media report should start with a summary of the purpose of the report, along with the objectives set for your social media marketing. For example, the report should offer a summary of your social media KPIs, goals and benchmarks for each channel.
This will help the reader understand what they can expect in the report, while also giving them enough context to determine the success or failure of the strategy based on the numbers presented in the report.
Highlight the most important results
The next step needs to be an overview of the important results that you want the reader to focus on. This should be tied to your social media KPIs and benchmarks.
Trying dedicating one slide to the most powerful stats from the previous month, including follower growth, accounts reached, engagements, website clicks and even sales from social media.
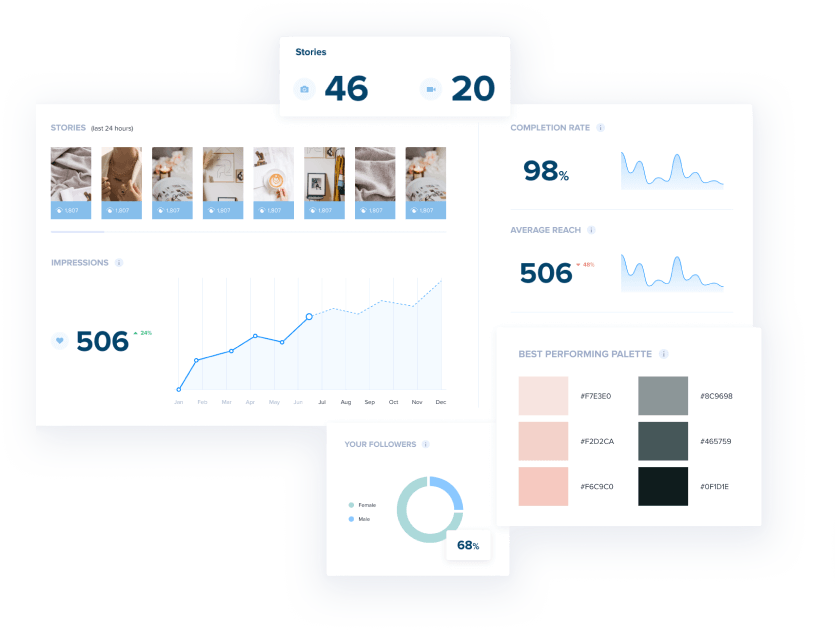
For a comprehensive overview and visually-appealing summary to add to your social media reports, you can use Plann’s built-in analytics tool that provides a stack of data across your social media channels.
Dive into the numbers
Once you’ve given an overview of the most important social media metrics, it’s time to delve deeper into the other results.
Try focusing on one channel at a time and really dive into this data across your audience and content. A few helpful metrics to track include:
Number of posts published
Top performing posts of the month
• Number of new followers
• Number of followers lost
• Number of likes, comments and shares
• Number of clicks to the website
• Number of story/post views
Plus, if you’re running ads on social media platforms, there are some other metrics you should add as well:
• Total ad spends
• Revenue generated from ads
• Number of leads or conversions
• Engagement on ad posts
By splitting your reporting by organic vs. paid social media activity, you can gather an accurate snapshot of your social media results.
Celebrate every win
Numbers may not always accurately represent the outcomes of a campaign. Perhaps you made your initial contact with a significant social media influencer. Perhaps a particularly powerful review was received on social media, which you will be able to utilize in future marketing initiatives.
Include any and all types of achievements that are related to your objectives in your social media report.
Highlight learnings and provide recommendations
This is when you go beyond merely reporting the statistics and truly analyze what the data implies.
For example, instead of just reporting the total number of interactions, you may want to look at the number of engagements by post or follower. This method may assist you in determining the content types and formats that are most effective with your target audience.
Try to figure out why you received the outcomes you did. Sure, the stats are fascinating, but the reasoning behind the data is what may help you fine-tune your approach and define relevant social media objectives.
By turning your insights into learnings, you can make strategic recommendations about how to boost your results in the months ahead.
Make social media reporting easy with Plann
We get it: creating stunning social media reports can take a stack of time and effort.
This is why we created an advanced social media report builder that can help you skyrocket your growth. In just a few clicks, your team can score in-depth reports that visualize your success on social media.
Plann’s in-built social media reports include advanced analytics tools that can help you discover the fastest path to success too! Sign up for a free 7-day trial of Plann today and you can manage your entire social media reporting from one effortless dashboard.